Before starting with Class 7 Science Chapter 9 i.e. ‘Motion and Time’, I am hoping that you have completed Chapter 8 of the 7th class. If not, then you can go through its Notes and NCERT Exercise Solutions whose links have been provided below. ⤵️
Table of Content
Introduction
In the 7th chapter of our 6th class, we have learnt about measuring distances and the various types of motions.
MOTION:
An object is said to be in motion or moving if it changes its position with time.
We have learned about 3 different kinds of motion:
- Rectilinear Motion: along a straight line.
- Rotational & Circular Motion: about a fixed axis or point.
- Periodic Motion: repeats after a fixed interval of time.
Table 9.1 Some examples of different types of motion
| Example of motion | Type of motion |
| Soldiers in a march past | Rectilinear |
| Bullock cart moving on a straight road | Rectilinear |
| Hands of an athlete in a race | Periodic |
| Pedal of a bicycle in motion | Circular |
| Motion of Earth around the Sun | Periodic |
| Motion of a swing | Periodic |
| Motion of a pendulum | Periodic |
We all know that a bullock cart moves slowly in comparison to a motorcar.
Slow or Fast
How do we get to know whether an object is moving fast or slow?
Well, one way we can determine this is by measuring the distance covered by the different objects in a fixed amount of time, i.e. the object that will cover the most distance in a fixed interval of time is said to be moving faster in comparison to the other objects.
EXAMPLE:
There are 3 friends (Abhay, Neeraj and Sam) and they decide to check which of their vehicles is fast and which one is slow by checking which vehicle is going to cover the most distance in 5 minutes.
- Abhay has a car.
- Neeraj has a motorbike.
- Sam has a bicycle.
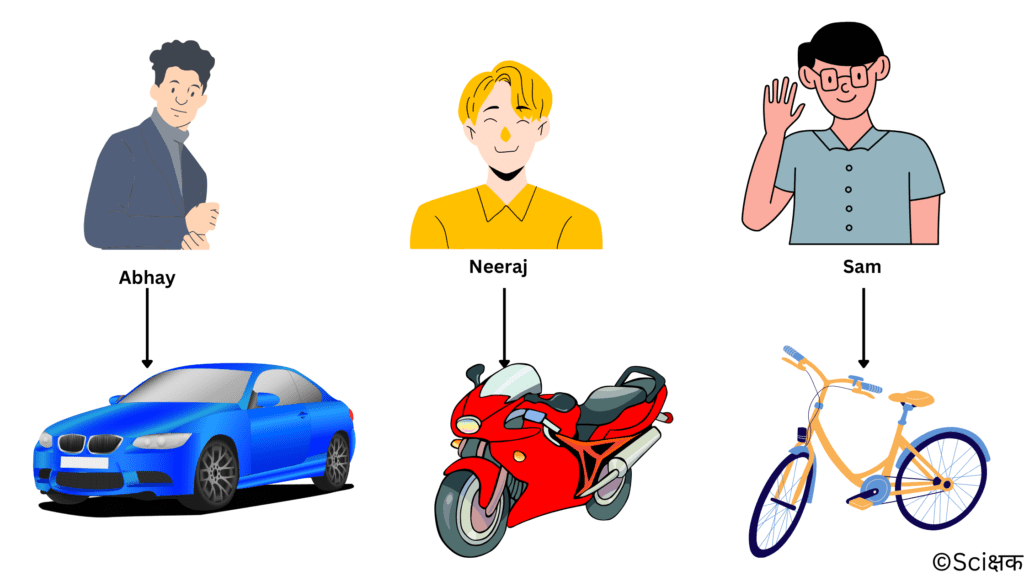
They started this race on an empty straight road, and after 5 minutes the distances covered by their vehicles were:
- Abhay’s car covered 7 kilometres.
- Neeraj’s motorbike covered 4.5 kilometres.
- Sam’s bicycle covered 1.5 kilometres.
From this, they interpreted that Abhay’s car is fast and Sam’s bicycle is slow.
The distance moved by objects in a given interval of time can help us decide which entity is faster or slower.
Speed
We all have heard about this quantity in our daily lives. This quantity indicates that a given distance has been covered in a shorter time, or a large distance covered in a given time.
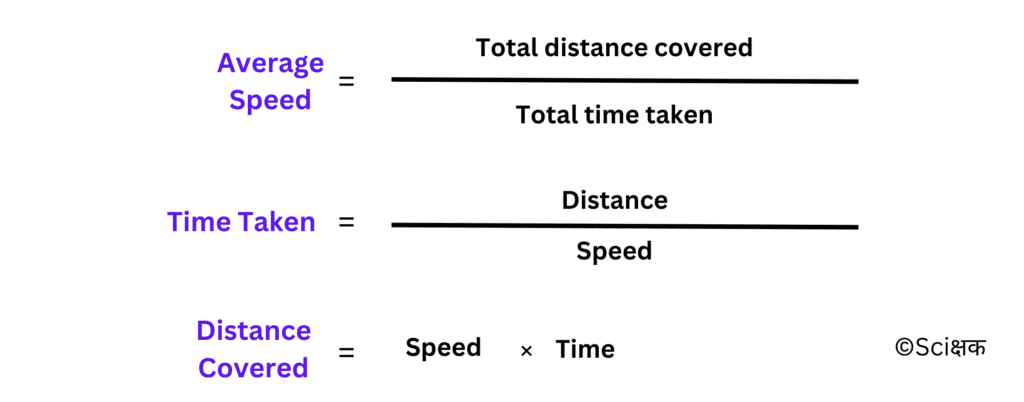
It is the distance covered by an object in a unit time.
Let’s say the speed of our car is 60 kilometres per hour, which means that the car covers 60 kilometres of distance in one hour. However, a car seldom moves at a constant speed. It starts moving slowly and then picks up speed. So, when we are saying that our car is moving at a speed of 60 kilometres per hour we are talking about the total distance covered by a car in an hour. So, we don’t bother whether the car is moving at a constant speed or not during that hour.
The speed calculated here is actually the average speed of the car. So, the average speed is:

NON-UNIFORM MOTION:
The motion of an object along a straight line is said to be non-uniform if its speed keeps changing.
UNIFORM MOTION:
The motion of an object along a straight line is said to be uniform if it is moving at a constant speed. In this case, the actual speed at any instant is the same as the average speed.
So, to measure speed we need two quantities distance and time. We have learned to measure distances in the previous class.
Now, let’s learn about measuring time now.
Measurement of Time
We use a device called a clock to decide what time of the day it is. But before the invention of the clock, our ancestors used to measure the time interval by noticing many natural events repeating themselves after definite time intervals. E.g.
- The time between two successive sunrises is called a day.
- A month was measured from one new moon to the next.
- A year was fixed as the time taken by the Earth to complete one revolution of the sun.
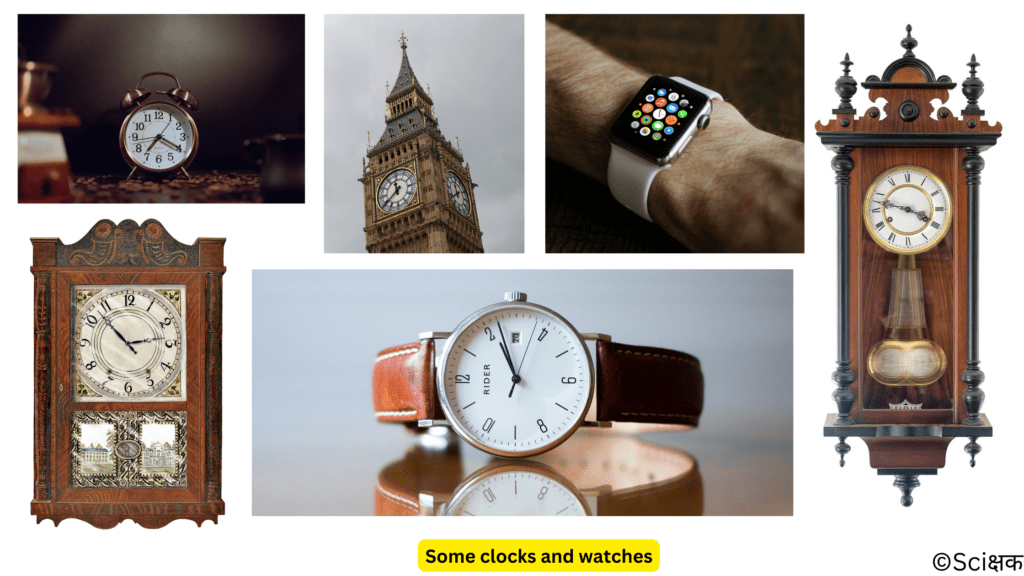
The working of a clock is quite complex, they all make use of some periodic motion. One of the most known periodic motions is that of a simple pendulum.
A Simple Pendulum
It consists of a metallic ball or a piece of stone called the bob suspended from a rigid surface by a thread.
The pendulum at rest is in its mean position. When the bob of the pendulum is released after taking it slightly to one side, it begins to move to and fro.
This to-and-fro (back and forth/आगे – पीछे) motion of a simple pendulum is an example of periodic or oscillatory motion.
The pendulum is said to have completed one oscillation when its bob, starting from its mean position O, moves forth (point A) then moves back (point B) and back to its mean position.
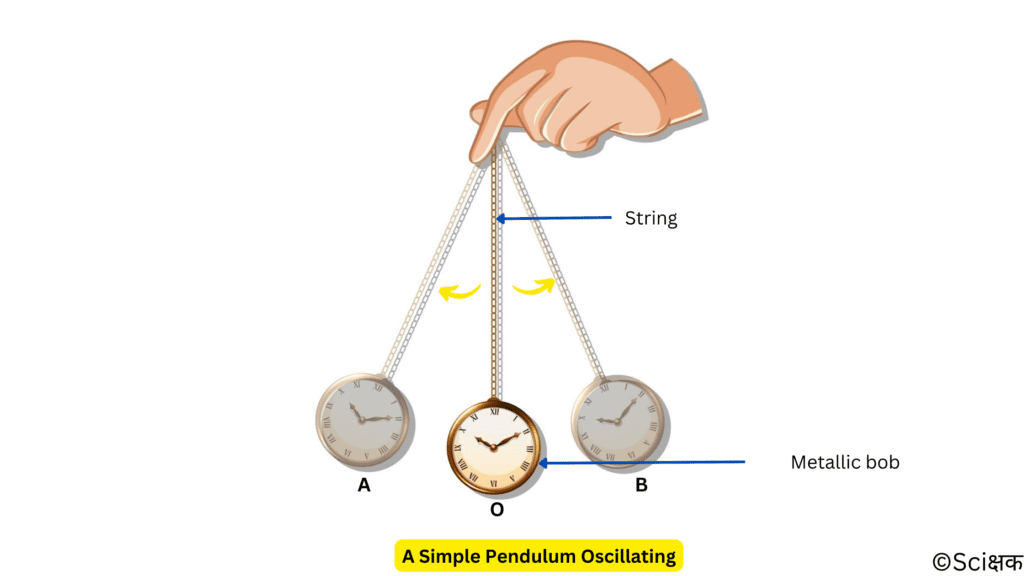
Or, the pendulum also completes one oscillation when its bob moves from one extreme position A to the
other extreme position B and comes back to A.
TIME PERIOD:
It is the time taken by the pendulum to complete one oscillation.
The pendulum of a given length always takes the same amount of time to complete one oscillation, which means that the time period of a pendulum of a given length is constant (it is not affected by how hard you push the bob from its mean position). This was discovered by one of the most famous scientists of all time, Galileo Galilei.
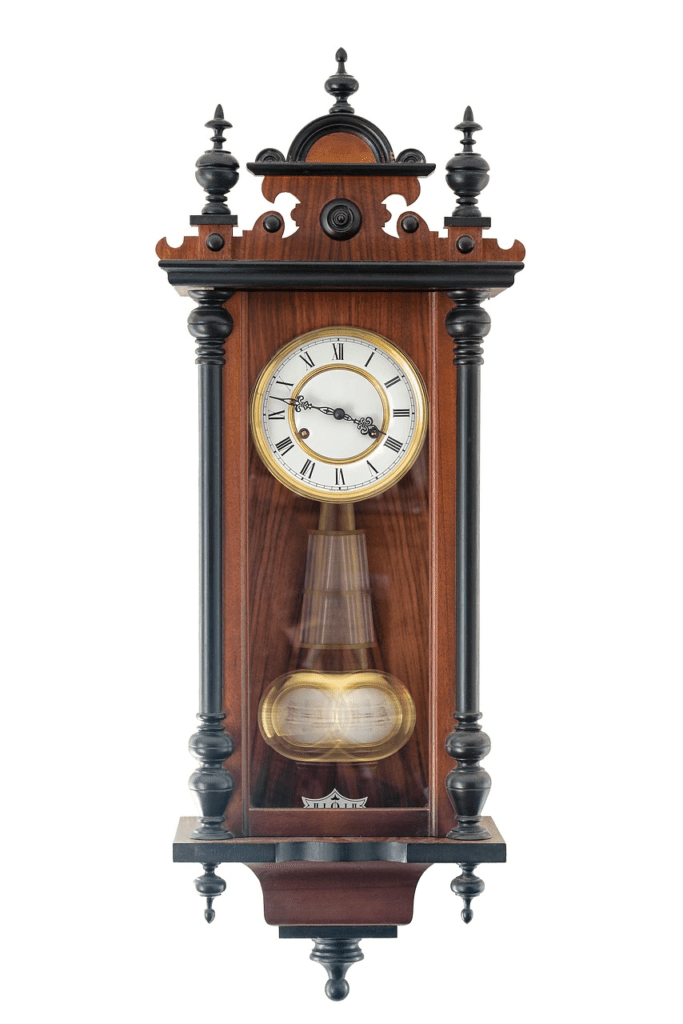
This observation led to the invention of pendulum clocks later they were succeeded by the winding clocks and the wristwatches.
Nowadays most clocks or watches have an electric circuit with one or more cells (battery). These clocks are called quartz clocks. They measure time more accurately than the pendulum clocks.
Units of time and speed
The basic and standard unit of time is a second. Its symbol is s. The larger units of time are minute(s), hour(s), day(s), year(s), etc.
Speed is the ratio of the distance travelled and the time taken. So, its basic unit is metres per sec or m/s.
The symbols of all units are always written in singular. E.g. your car’s speed is 50 kilometres per hour so it will be written as 50 km/hr, not 50 kms/hr.
We use different units of time for our convenience. For example, we express our age in years rather than in days or hours, times of historical events are stated in terms of centuries and millenniums, the age of stars is often expressed in billions of years, etc.
Did You Know?
The time taken to say aloud “two thousand and one” is nearly one second.
Smaller Units of Time
The smallest time interval that can be measured with commonly available clocks and watches is one second. But there are several time intervals that are smaller than a second.
- A microsecond is one-millionth of a second.
- A nanosecond is one billionth of a second.
Such time intervals are used for scientific study.
The time-keeping services in India are provided by the NPL (National Physics Laboratory), New Delhi. The clock they use can measure time intervals with an accuracy of one-millionth of a second.
Did You Know?
The most accurate clock in the world has been developed by the National Institute of Standards and Technology in the U.S.A. This clock will lose or gain one second after running for 20 million years.
Measurement of Time in the Ancient World
Many time-measuring devices were used in different parts of the world before the invention of pendulum clocks. E.g.
- Sundials

- Water clocks (clepsydra)

- Sand clocks, etc.

are such devices. Different designs of these devices were developed in different parts of the world.
Measuring Speed
Now that we have learned to measure time and distance, we can measure the speed of any moving body.
ACTIVITY TO LEARN TO MEASURE THE SPEED OF A MOVING OBJECT:
- Draw a straight line on the ground with chalk powder.
- Then roll a ball from behind the line, the moment the ball reaches the line turn on your stopwatch to measure the time it takes for the ball to stop moving (rolling) and mark the end point of the ball with chalk.
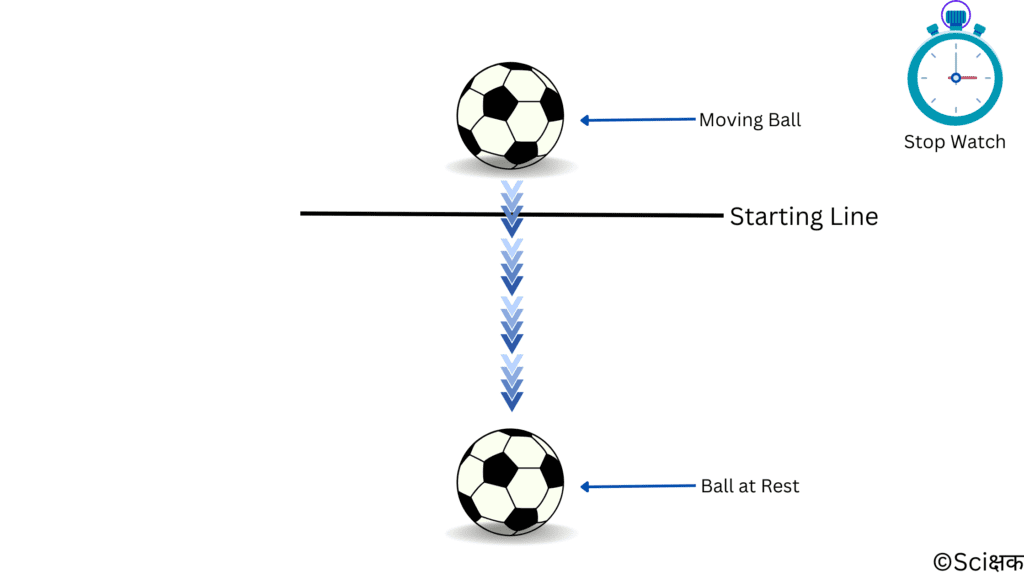
- Now measure the distance from the starting line to the endpoint.
- Now calculate the speed of the moving ball using the measured distance and the measured time.

Did You Know?
The speed a rocket needs to go out of Earth’s atmosphere into space is ~11.2 Km/s.
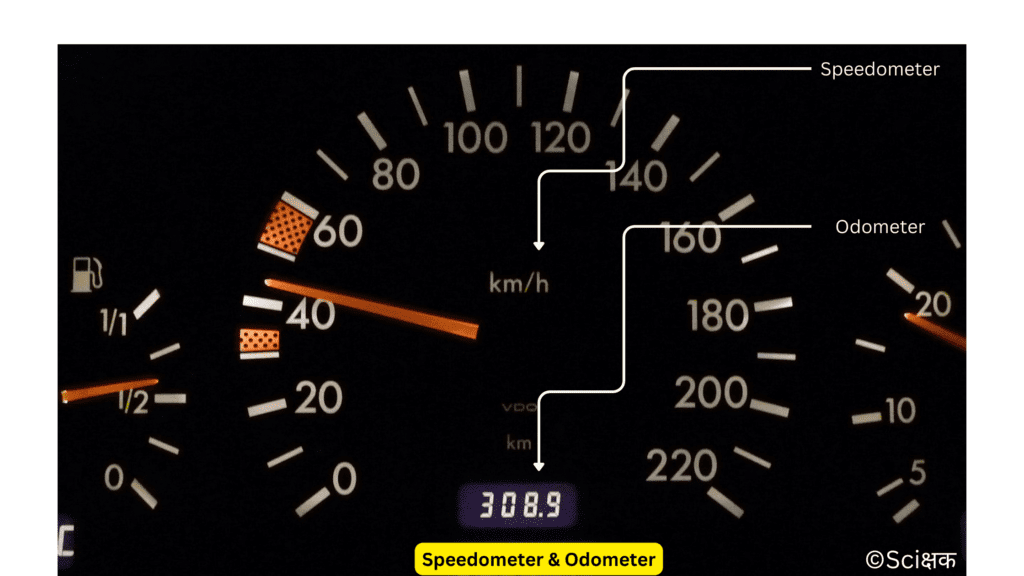
SPEEDOMETER:
It is a device/meter that measures the speed of a moving vehicle.
ODOMETER:
It is a device/meter that measures the distance moved by the vehicle.
Graphical Representation of Data
Ansh studies in the 7th class at XYZ School, New Delhi. During his holidays he went to Mussoorie with his family and during his journey, he noted down the readings of the odometer of the car every 30 minutes till the end of the journey.
| Time | Odometer Reading | Distance covered by the car from the starting point |
| 8:00 AM | 11,000 | 0 km |
| 8:30 AM | 11,030 | 30 km |
| 9:00 AM | 11,060 | 60 km |
| 9:30 AM | 11,090 | 90 km |
| 10:00 AM | 11,120 | 120 km |
| 10:30 AM | 11,150 | 150 km |
| 11:00 AM | 11,180 | 180 km |
| 11:30 AM | 11,210 | 210 km |
| 12:00 PM | 11,240 | 240 km |
| 12:30 PM | 11,270 | 270 km |
| 1:00 PM | 11,300 | 300 km |
His father gave him some tasks/problems based on his readings from the odometer:
- How far is Mussoorie from New Delhi?
- Can you calculate the average speed of the car?
Ansh was able to solve the problems provided to him by his father.
- Mussoorie is 300 km from New Delhi.
- The average speed of the car is 300/5 = 60 km/h
Ansh’s father provided him with a new problem i.e. whether he can tell, how far they would have travelled till 10:15 AM from New Delhi.
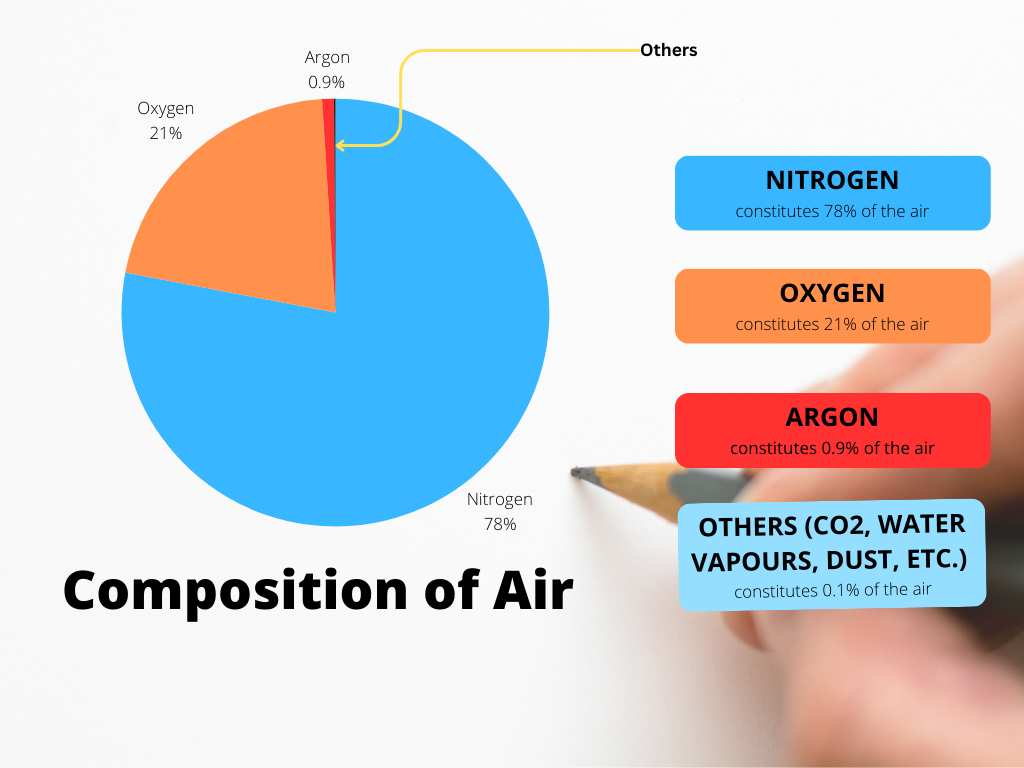
Ansh wasn’t able to solve this problem, so his father introduced him to various types of graphs or visual representations of data i.e. pie charts, line graphs, bar graphs, etc. and also guided him that the above problem would be solved with the help of a distance-time line graph.
EXAMPLE OF A PIE CHART:
EXAMPLE OF A BAR GRAPH:
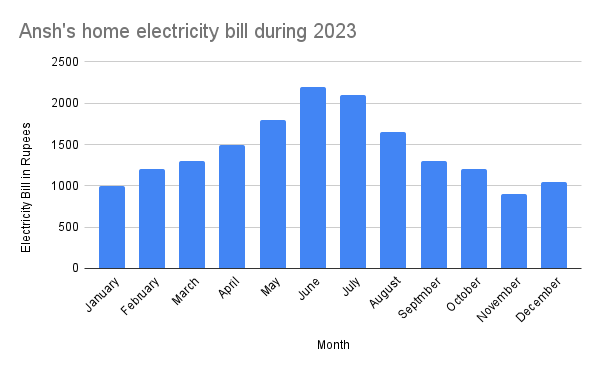
The electricity bill of Ansh’s home for each month during 2023 is represented using a bar graph:
| Month | Electricity Bill in Rupees |
| January | 1000 |
| February | 1200 |
| March | 1300 |
| April | 1500 |
| May | 1800 |
| June | 2200 |
| July | 2100 |
| August | 1650 |
| September | 1300 |
| October | 1200 |
| November | 900 |
| December | 1050 |
LINE GRAPH (DISTANCE-TIME GRAPH):
Let’s learn to make a line graph using the data recorded by Ansh during his travel to Mussoorie.
- Take a sheet of graph paper and draw two lines perpendicular to each other on it.
- Mark the horizontal line (known as the x-axis) AX and mark the vertical line (known as the y-axis) YB.
- The point of intersection of AX and YB is known as the origin and it is marked as ‘O‘.
- The two quantities (distance and time in this case) between which the graph is drawn are shown along these two axes.
- The positive values on the x-axis are shown on the right side (OX side) and the negative values are shown on the left side (OA side).
- Similarly, the positive values on the y-axis are shown on the upper side (OY side) and the negative values are shown on the lower side (OB side).
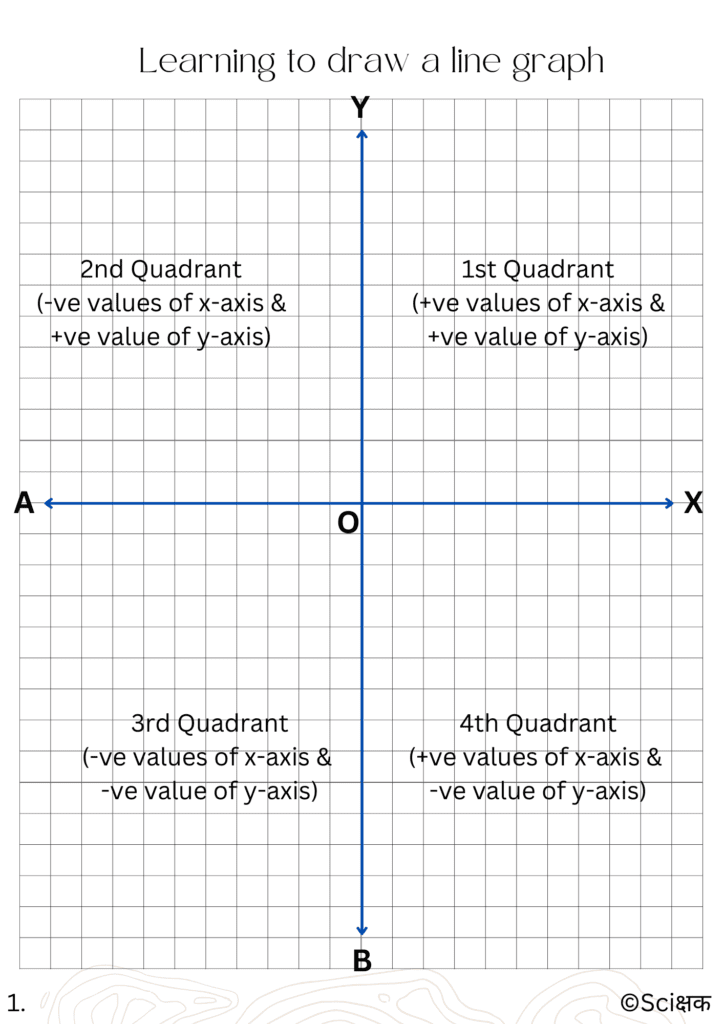
- We only have the positive values of distance and time so we are only going to take the positive quadrant of the graph paper (XOY quadrant).
- We have decided to show the distance along the y-axis and the time along the x-axis.
- Now, we have to choose an appropriate scale to represent the distance and time on the y-axis and the x-axis respectively.
POINTS TO KEEP IN MIND WHILE CHOOSING THE MOST SUITABLE SCALE FOR DRAWING A GRAPH ARE:
- the difference between the highest and the lowest value values of each quantity.
- the intermediate value of each quantity, so that with the scale chosen it is convenient to mark the values on the graph paper, and
- to utilize the maximum part of the graph paper.
- The scales that we have chosen for representing both quantities are:
Time: 30 min = 1 cm of graph paper on the x-axis.
Distance: 15 km = 1 cm of the graph paper on the y-axis.
- Now, mark the values for time and the distance on the respective axes according to the scale.
- Now let’s draw the line graph using the observation table.
- Draw a dotted line perpendicular to the x-axis for the values of respected time and a perpendicular dotted line perpendicular to the y-axis for the values of the respected value of distance covered by the car.
- The point of intersection of these two dotted perpendicular lines represents this set of values on the graph.
- Now mark all the points corresponding to the different sets of values on the graph paper.
- Join all the points on the graph to get your line graph for the given data.
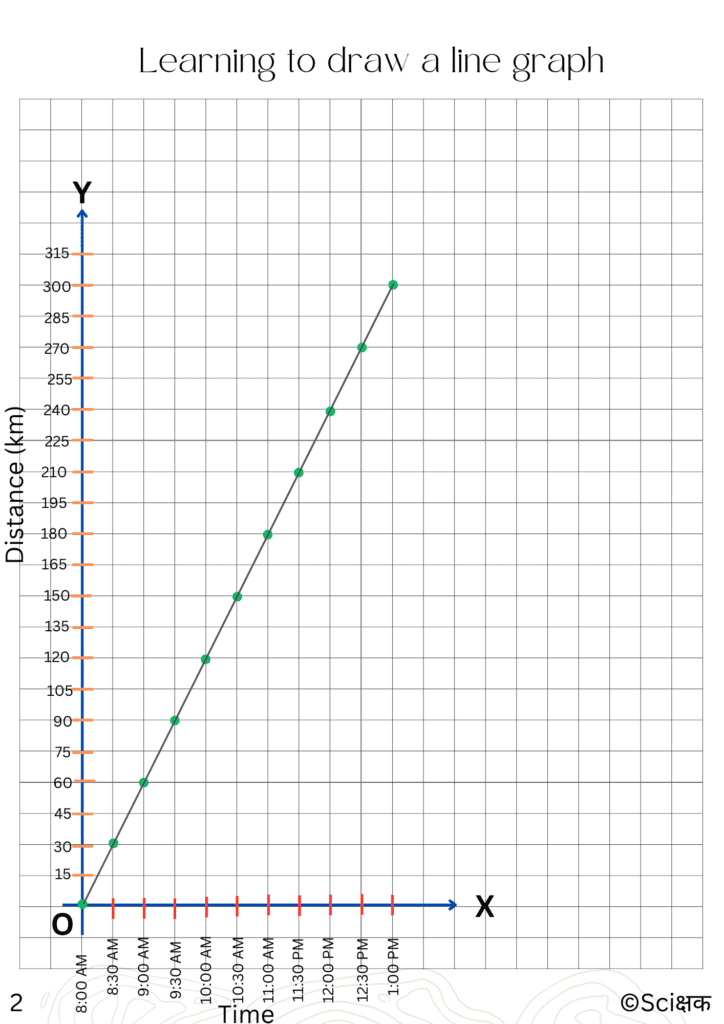
If the distance-time graph is a straight line, it indicates that the object/car is moving with a constant speed and if it is of some other shape it means that the object is moving with a variable speed.
Finding the distance moved by an object at any instant of time using a distance-time graph
Now, let’s go back to the problem that Ansh’s father presented to him i.e. how far they would have travelled till 10:15 AM from New Delhi.
If Ansh tries to solve this problem just by using the data from the table then he will not be able to solve this problem because he doesn’t have the required data for this particular time interval (10:15 AM).
He has to take the help of a distance-time graph because with this graph he can find the distance moved by the object/car at any instant in time.
So, let’s help Ansh solve this problem:
- Draw a dotted line perpendicular to the time interval (10:15 AM) at which we want to find the distance moved by the car.
- Mark the point (K) on the line graph where this dotted line intersects with it.
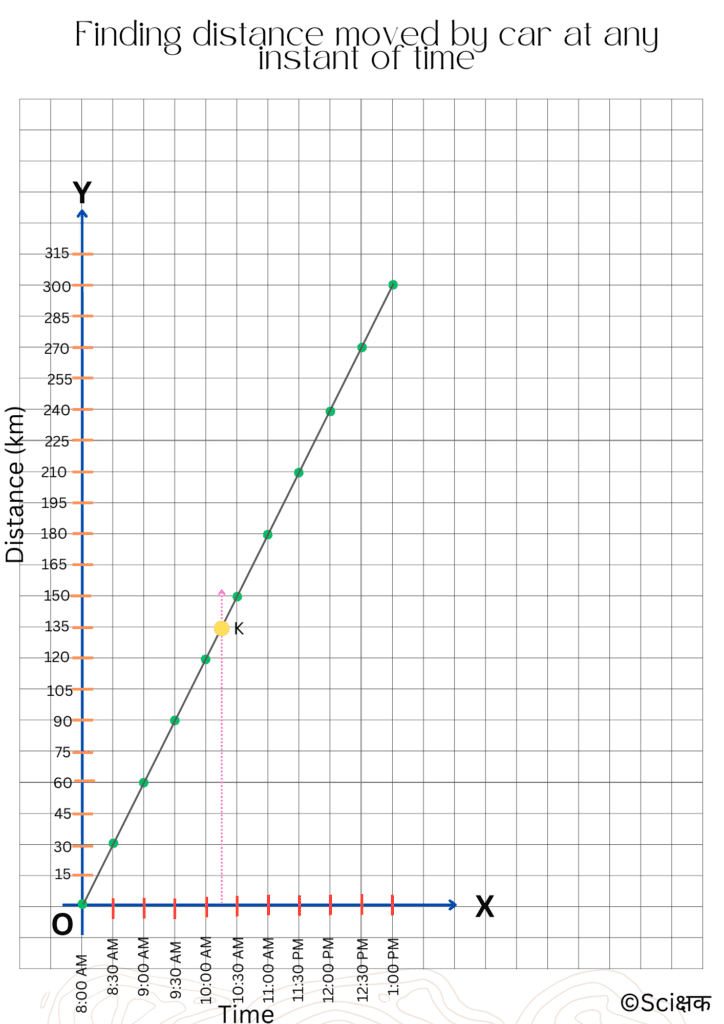
- Now draw another dotted perpendicular line on the y-axis (distance axis) from this point K and mark the point (M) where this perpendicular line intersects with the y-axis.
- The value of point M is actually the distance moved by the car at 10:15 AM.
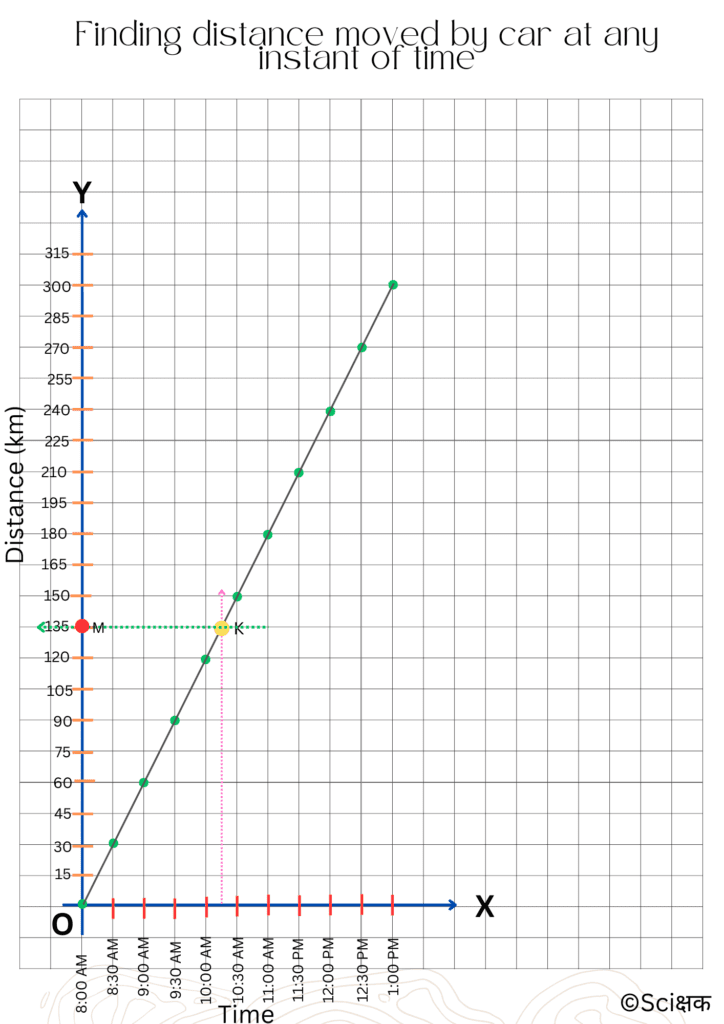
So, the distance covered by the car by 10:15 AM is 135 km.
Conclusion
The graphical representation of data has several benefits and one of the most important benefits of it is that it’s easier to comprehend and analyze the data in graphical form than in tabular or raw form. You will get to learn about some more different ways of representing data visually in higher classes.
Credits & References
- Class 7th Science NCERT Textbook
- Image by fancycrave1 from Pixabay
- Image by Pexels from Pixabay
- Image by winterseitler from Pixabay
- Image by Vizetelly from Pixabay
- Image by Giada Turola from Pixabay
- Image by Ruslan Sikunov from Pixabay
- Image by brgfx on Freepik
- Image by winterseitler from Pixabay
- canva.com
- Image by LoggaWiggler from Pixabay
- Image by Nile from Pixabay
Thank You for Choosing Sciक्षक ❤️

